
Elongational Viscosity & Impact Testing Case Studies
Please select a case study below:
Shear Stress Case Study
The problem: How to optimise the efficiency of a reactive extrusion process.
The process involved the reactive extrusion of linear low density polyethylene (LLDPE) with dicumyl peroxide dissolved in a carrier solvent. The peroxide/solvent solution was injected into a port on a 30mm, 40L/D, twin screw extruder. The aim of the work was to investigate the efficiency of the peroxide for active site formation in a macromer grafting process.
The LLDPE was extruded at various throughputs and thus residence times. As the extruder throughput increased the peroxide/LLDPE ratio was kept constant via proportional injection rate changes. Extrudate was then collected from a strand die and pelletised for characterisation using the capillary rheometer.
What did the rheometry tell us? Curiously, the stress curves were different for each flow rate. Since the proportion of peroxide was constant for each extruder throughput, it was expected that the degree of reaction would be identical and the viscosities equal encouraging the stress curves to superimpose.
The resulting changes in shear stress function measured due to changes in weight average molecular weight ( ) are shown in the diagram below. The lowest stress values, and thus viscosities, were recorded at the lowest throughputs, suggesting poor reaction, however the residence times were greatest at these flow rates. The highest stress values were recorded at the higher throughputs where the residence time was least.
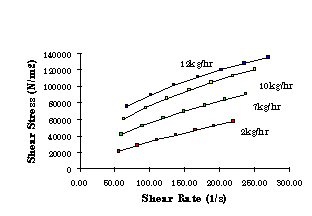
Different shear stress functions created by the reactive extrusion of LLDPE over a range of flow rates using a 0.1% organic peroxide addition.
No gel was detected using a traditional gel content method, thus it was assumed any viscosity changes were due to chain extension rather than cross-linking. The shear stress functions proved to be very sensitive to the degree of chain extension and thus state of reaction.
It was later established that at the low throughputs, the degree of fill within the extruder screws was also low, consequently, mixing and reaction efficiency was poor.
Action taken: The screw configuration and speeds were changed to improve mixing.
Measurements conducted: Shear stress sweeps at 180ºC on collected pellets.
Elongational Viscosity Case Study
The flow of traditional engineering fluids such as water and oils (n=1 in the figure below) is envisaged as laminates of fluid sliding past each other having zero velocity at the wall and some maximum value at the centre of the flow geometry.
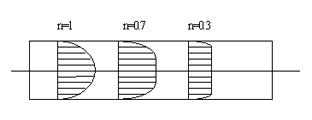
Since most polymers in the melt, or processing, phase are visco-elastic (n=0.3 & 0.7), they also stretch, and the resistance to this elongation is termed the extensional viscosity.
Due to elasticity, restoring forces are also established in the direction of deformation, which act to return the melt to its original state. The results of elasticity are often manifested as die swell and/or frozen-in stresses which can be problematic post-processing.
Extensional viscosity is important in polymers since the resistance to extension is sensitive to different aspects of their molecular architecture than the resistance to shear or the magnitude of the restoring forces.
The problem: Similar shear viscosity curves and near identical MFI values suggest two polymers are the same, but they behave differently in-process.
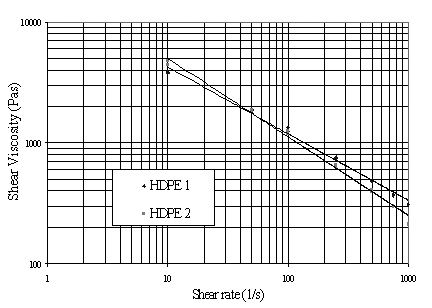
Near identical shear viscosity functions for two dissimilar HDPE grades.
Once the elongational viscosity functions were measured it was clear that the two melts were very different. It was subsequently established that the polymers were produced using dissimilar catalyst systems; Ziegler-Natta and Phillips.
It is well known that using the Phillips catalyst produces polymer with a broader molecular weight distribution (MWD) which has the effect of increasing the resistance to elongation. These polymers were being used for film blowing which is sensitive to melt elongation, thus they behaved very differently in-process.
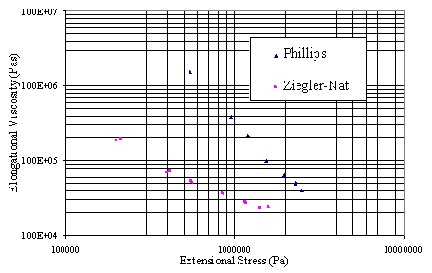
Elongational viscosity functions for two HDPE grades with dissimilar MWD.
What did the rheometry tell us?
The elongational viscosities were very different and thus exposed the catalyst type used to produce them. It was also apparent that MFI and shear viscosity measurements were effectively blind to the changes in MWD.
What measurements were made?
Extensional viscosity vs extensional stress on the twin bore capillary rheometer.
What action was taken?
The polymer was selected for this film blowing application on the basis of its elongational viscosity and not its traditional MFI value. MFI was dropped as a QC method for this application. GPC measurements proved the difference in MWD.
Melt Fracture Case Study
Melt fracture manifests itself as surface irregularities in extrusion, consequently it is a problem in many processes including, film, sheet, pipe, profile, co-extrusion, cable and wire extrusion. Some of the common names for melt fracture, or extrudate surface distortion, are: sharkskin, stick slip fracture and wavy fracture.
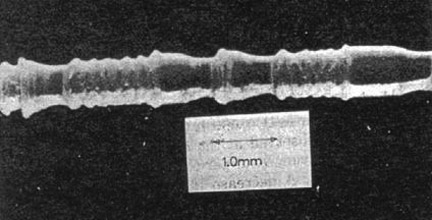
Melt fracture in an extruded polymer filament.
Melt fracture is very difficult to eradicate once established thus it is easier to identify the stresses at which it occurs and avoid them by manipulating the processing window (temperature & throughput) or by die geometry changes.
How can rheometry tell us about melt fracture? In a typical rheometry test, a steady pressure must be established prior to the calculation of shear stress and viscosity. If oscillation of this pressure is experienced, melt fracture must be suspected. This oscillation will often correlate with the extrudate distortions seen in the above figure.
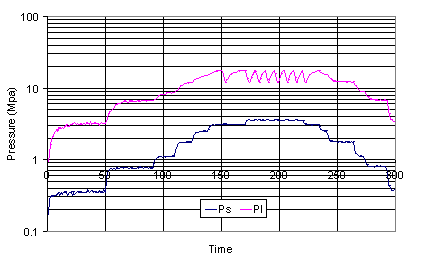
Oscillating pressure is a sign of melt fracture in LLDPE.
What did the rheometry tell us?
The results established the critical stress at which melt fracture or surface distortion began in a pipe extrusion.
What action was taken?
It was possible to determine a range of different throughputs and temperatures which would allow extrusion to take place below the critical stress.
What measurements were made?
Shear viscosity over a range of shear rates typical of those found in the process die.
Instrumented Impact Testing Case Study
Examining the effect of thickness and weave orientation on the impact properties of carbon fibre.
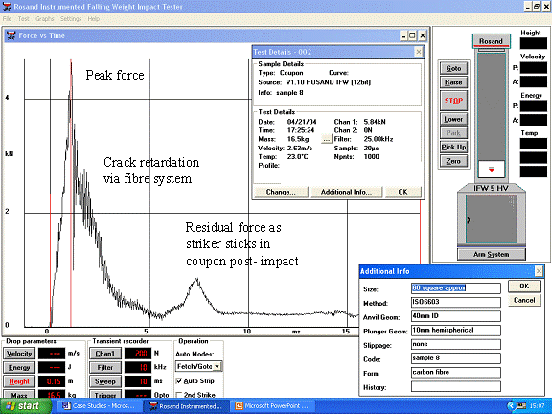
The above force vs time graph is a typical plot from an instrumented impact test, whereby a mass and striker assembly has been dropped from a pre-set height, in order to provide a known impact energy and velocity, onto a test sample to examine its impact properties. The material in this case was a carbon fibre composite, and the purpose of the programme was to investigate the effects on impact resistance of sample thickness and weave orientation.
The figure shows an initial sharp rise in force culminating in a peak value, beyond which the force drops rapidly. The initial sharp rise is typical of the hard, brittle, nature of many composite matrix systems. Were it not for the fibre reinforcement, the force would have dropped almost instantly to zero, and the coupon would have failed dramatically (shattered) within 2ms.
However, it can be seen that whilst the force initially drops sharply, it is subsequently retarded, via the fibres, and this retardation acts to introduce toughness. If the area under the corresponding force vs deflection plot is calculated, the energy dissipated in the failure event can also be determined.
Consequently, if we can retard the initial force reduction, we can increase energy dissipation and toughness, and substantially prolong the impact event. In reality, this means that any component sustaining such a service impact will not fail dramatically, but continue to function, albeit with diminished properties; precisely what is required of aircraft control surfaces in which most carbon fibre is used.
The figure below shows the results of increasing the sample thickness and it is clear that peak forces rise as expected. Closer inspection also shows that the weave orientation changes the way in which the force vs time, failure finger print, changes, enabling manipulation of the toughness via both weave and thickness.
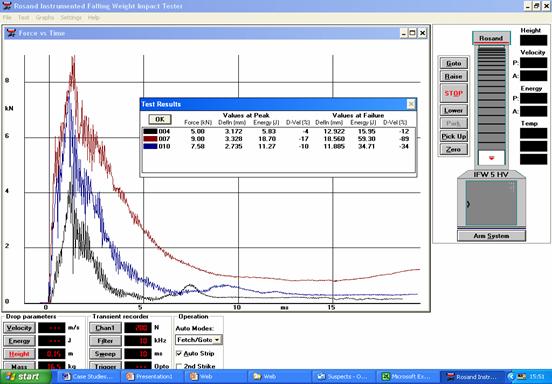
Unlike a pendulum technique, the instrumented falling weight (IFW) system allows more data to be measured throughout the entirety of the impact event, enabling more in-depth analysis of the failure mechanism. This is due mainly to the use of a peizo electric load cell which is located between the striker and the mass.
Thus on contact with the sample, the load cell is compressed and the force computed, allowing force to be measured throughout the impact event over times as low as 1ms. The system is so flexible it allows forces from 10 to 50,000N to be measured, enabling all manner of test samples to be examined from 20micron films to tough, carbon fibre, composites.
Telephone:
01299 251 914
Our postal address:
Fleming
Polymer Testing Ltd,
Holly House
Hartlebury
Kidderminster
DY11 7TE UK